Divvy Analysis
Divvy bikes is a bike share company in Chicago that provides almost 600 docking stations around the city for users to start and end trips. The data used in this analysis is comprised of over 11,000,000 million trips taken between 2015 and 2018. Unfortunately, only subscribed riders are paired with gender data, so the following analysis only looks at subscribed users instead of casual users.
The general trend shows a steady increase in users since 2015 but no extreme change. The data also shows that over the 4 year period, only 25% of the riders are female and the other 75% of riders are male. The following analysis aims to describe and explain the difference in gendered Divvy bike usership.
The following analysis uses U.S. Census Bureau data from the 2017 American Community Survey in conjunction with the Divvy bikes data.
2015 Male Trip Starts
2015 Female Trip Starts
2018 Male Trip Starts
2018 Female Trip Starts
2018 Male Trip Starts Over Income
2018 Female Trip Starts Over Income
2018 Male Trip Starts Over Race
2018 Female Trip Starts Over Race
The results show that more male trips are focused in the West Loop and Loop areas which make up the Central Business District of the city. This implies that most male trips are work related, either transportation to or from work. Most female trips are dispersed along the Loop and residential to the north of the Loop and just south of the Loop. These trips are much more dispersed than male trips and show that they may be more home related as compared to male trips. The changes from 2015 to 2018 illustrate that overall more trips took place, and the growth followed the same pattern in 2018 as it did in 2015.
When the density of trips is compared to income in the city, the female trips closely fit to the higher income areas. Male trips also follow the income trend, but not as closely as female trips. The close fit with income shows that the more affluent a neighborhood is, the more likely its female residents are to ride Divvy bikes. The possible reasoning behind this is broad, however there are a few reasons that seem to fit more than others. First, it is possible that roadways in more aflfuent neighborhoods are better cared for, and offer a safer and cleaner route for cyclists. Second, it is possible that more affluent neighborhoods require fewer women to work for income, and thus the women have more time to either leisurely ride Divvy bikes, or ride strictly for transportation purposes. Third, it is possible that Divvy bikes are seen as an unnecessary expense to potential users in less affluent neighborhoods. In either case, there is a key disparity between female Divvy bike usership in poor neighborhoods and affluent neighborhoods. This disparity, with further analysis, could point to a key determinant of female Divvy bike usership and could be used to increase female ridership.
When the density of trips is compared to race in the city, the female and male trips both loosely follow the majority white trend. However, the relationship falls apart when we look further north of the Loop where nieghborhoods become almost entirely residential and less densely developed. While the percentage of white residents seems to effect the lack of usage on the south and west sides of the city, the relationship on the north side may deteriorate because of other factors.
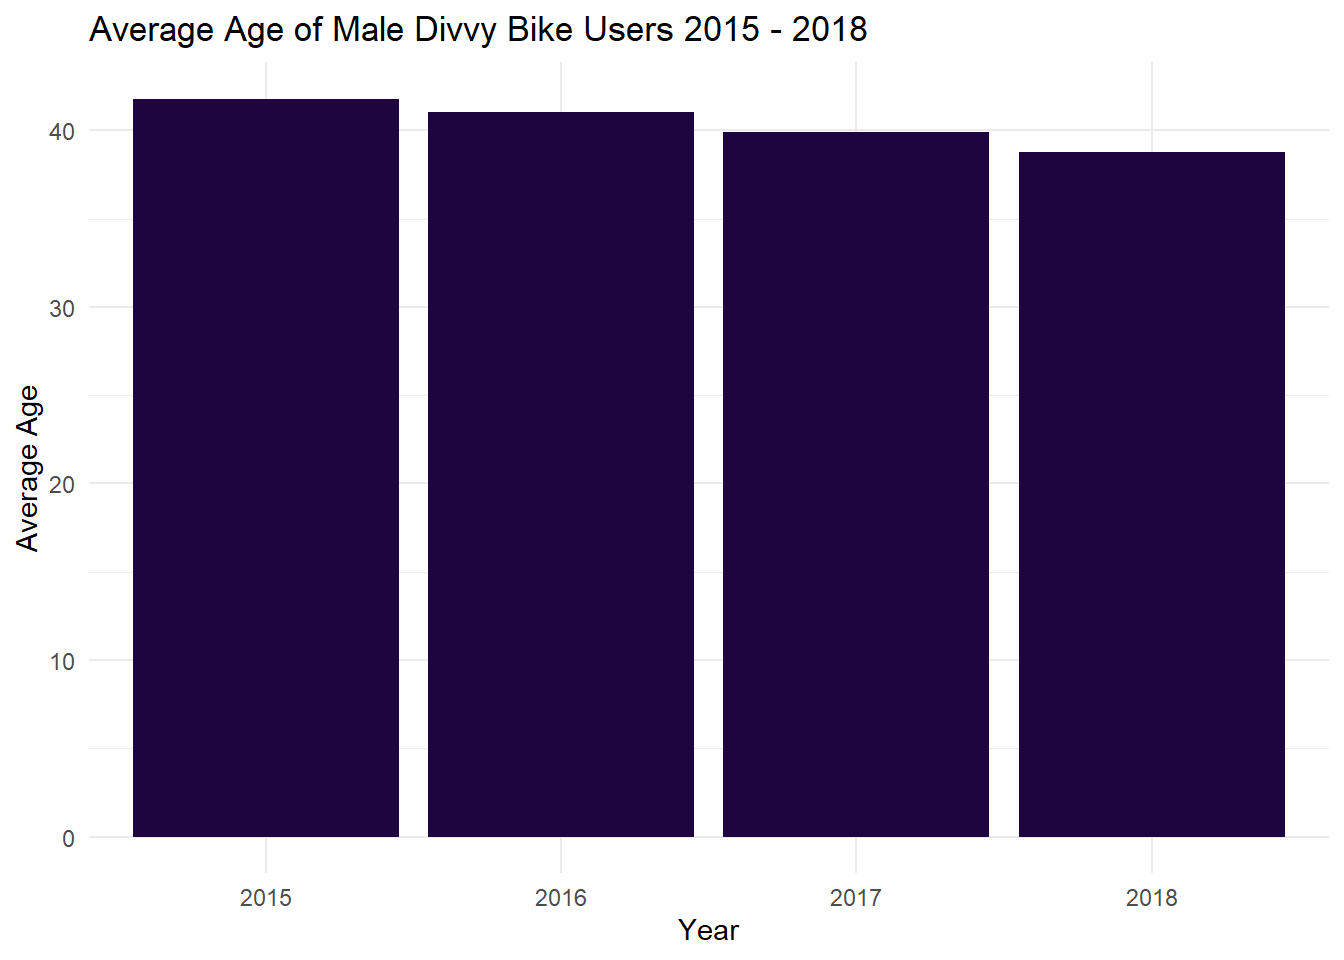
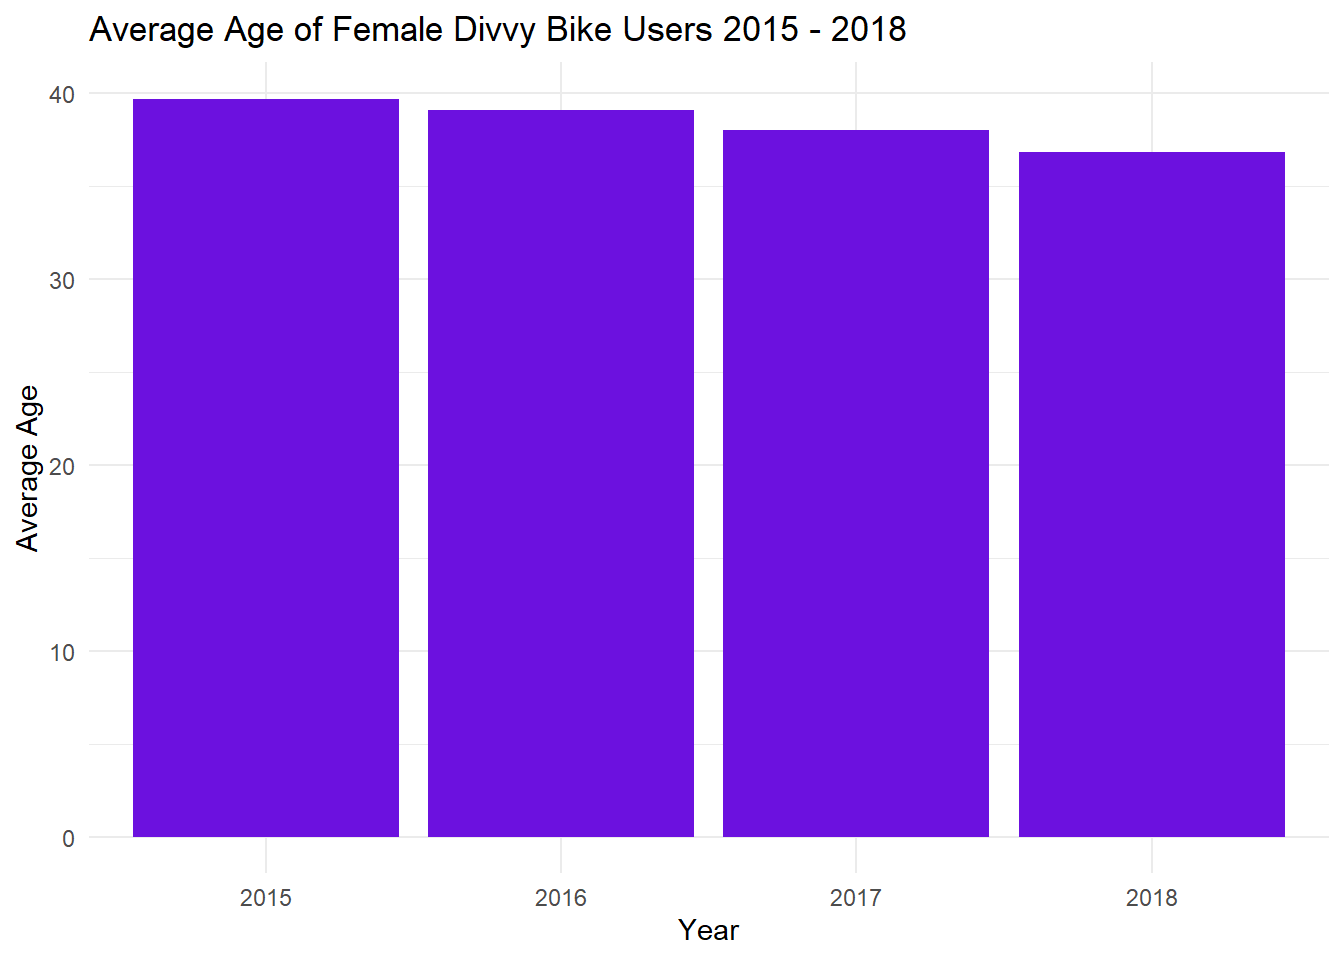
The analysis of the age of Divvy bike users illustrates that generally the ages difference between male and female users is minimal. Both male and female users have trended younger in the 4 year period, however only by 2-3 years.
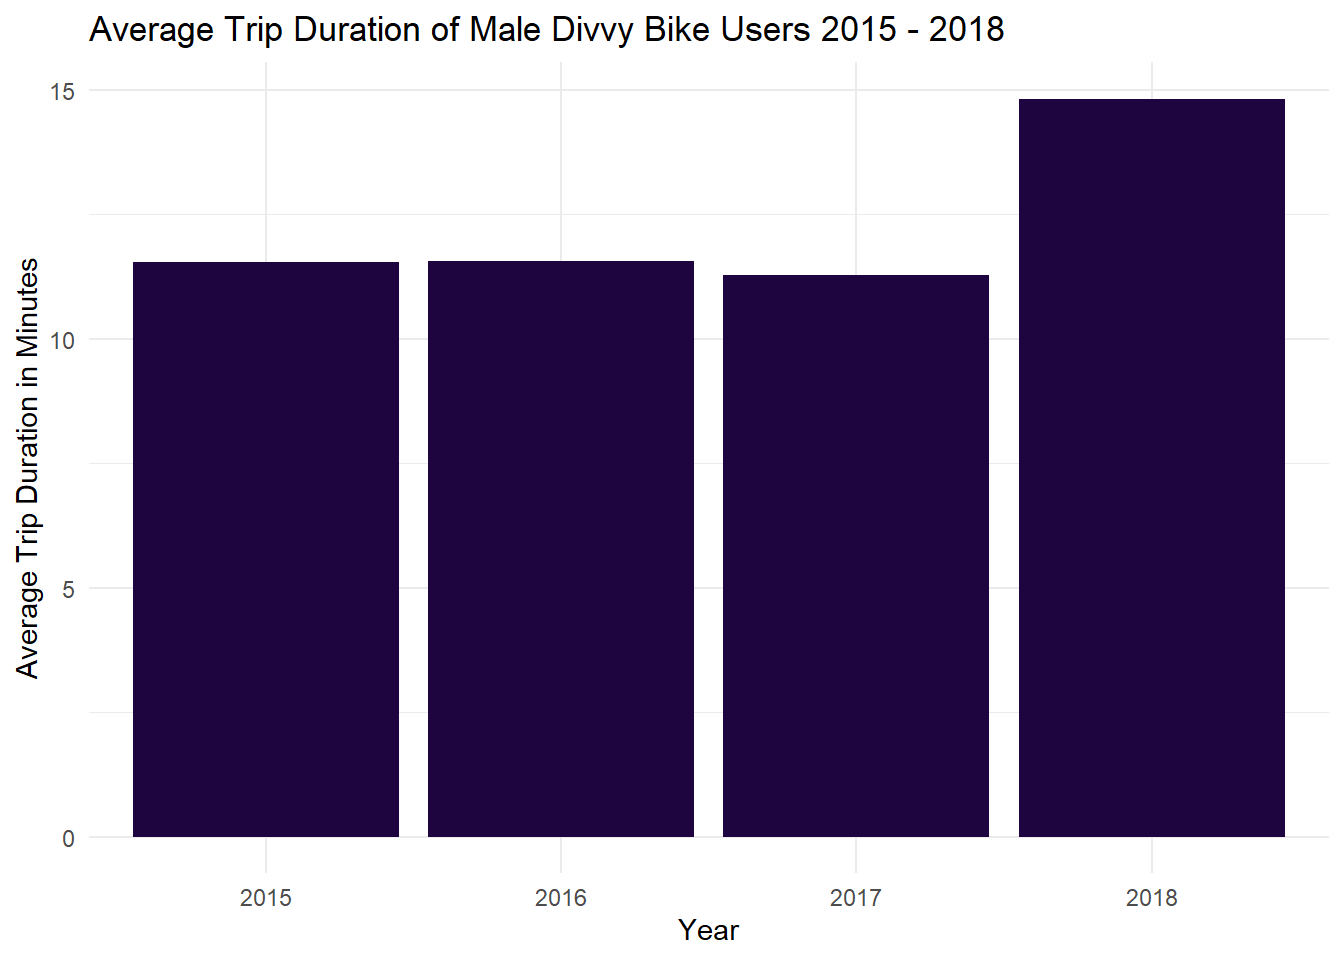
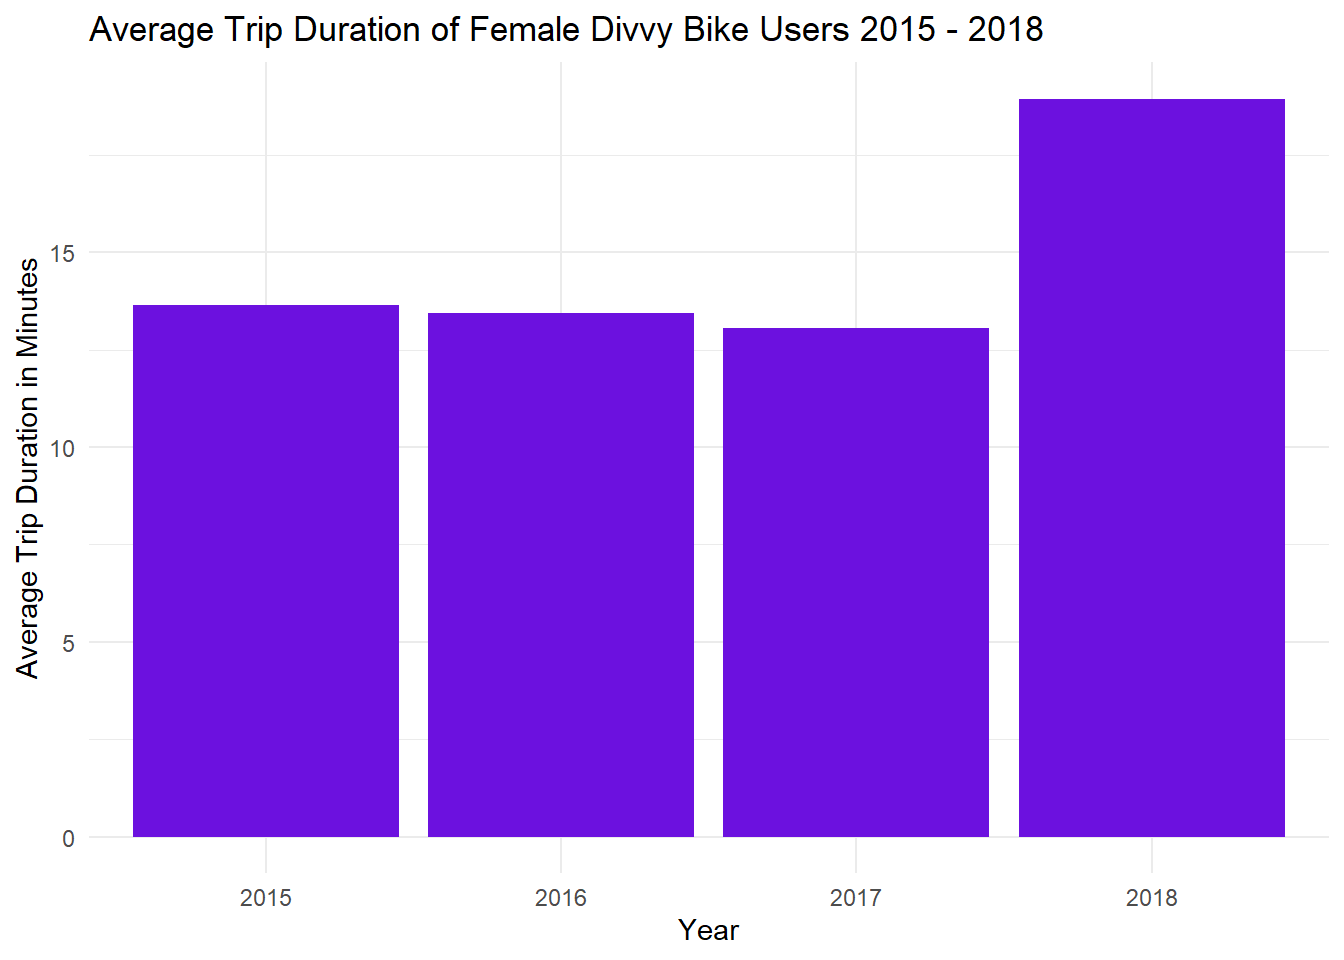
The analysis of the trip duration of male and female Divvy bike users shows that male trips are always 3-5 minutes shorter than female trips. This time difference could be explained by the differing purposes in male and female trips, however the consistency and shortness of the time difference implies that it may be due to females generally riding slower than male riders. This distinct difference offers some surprising insight onto one deterrent for female Divvy bike users. A trip that takes 5 minutes for a male user could take a female user 8-10 minutes and even that small time difference can influence a transportation decision for many people. Mode choice is a complicated topic but even small changes in the utility of a mode and a cost of a mode can change people’s minds. One interesting comment that this analysis brings to light is that it may be important to take into account gender when looking closely at mode choice and trip assignment in a transportation model. Of course on a large scale project the differences wouldn’t be too important, but at the neighborhood level the planning implications could be massive.
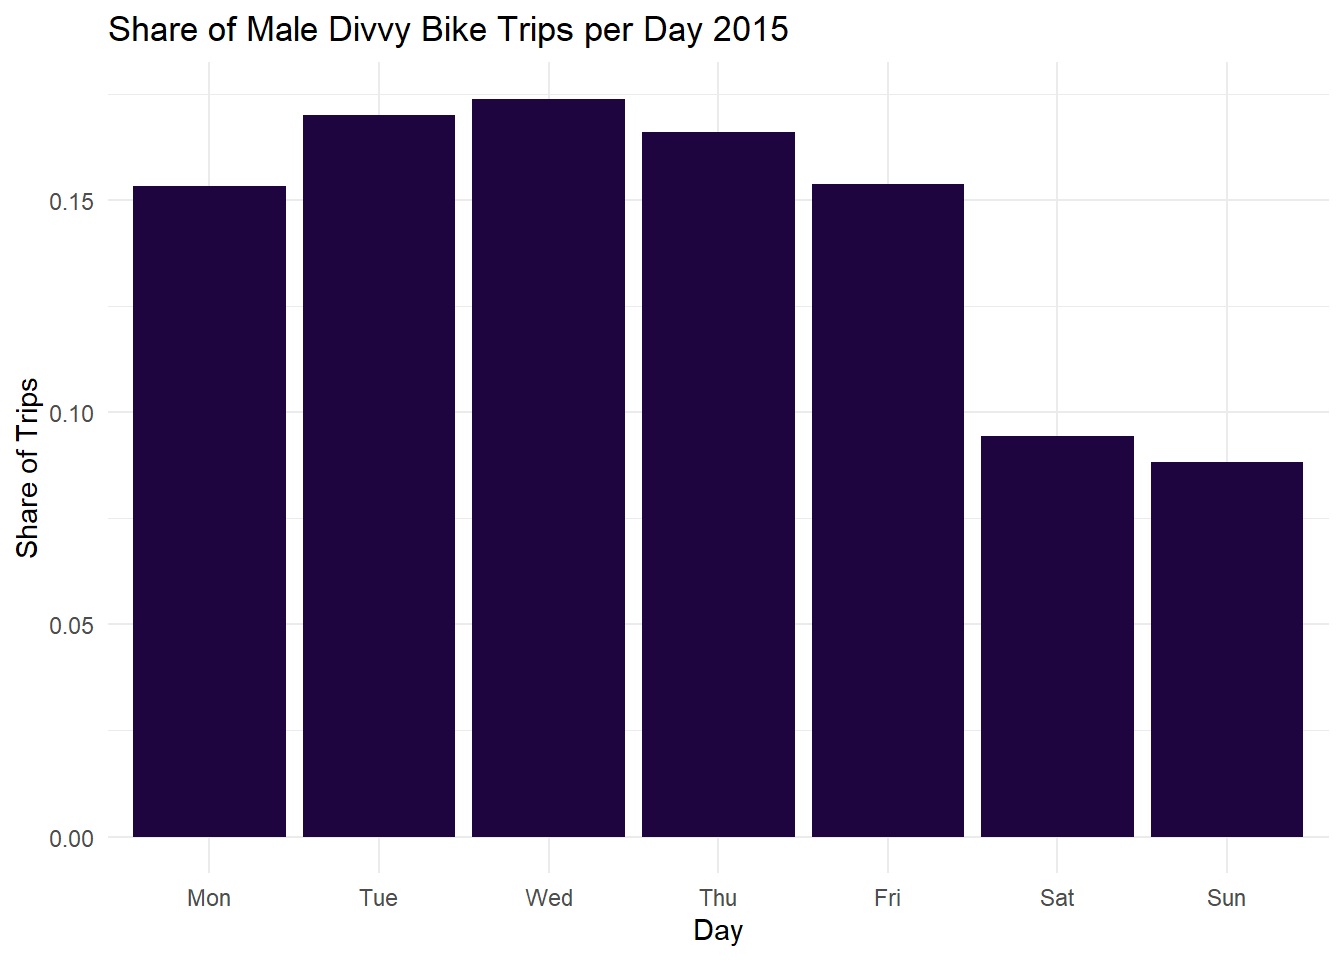
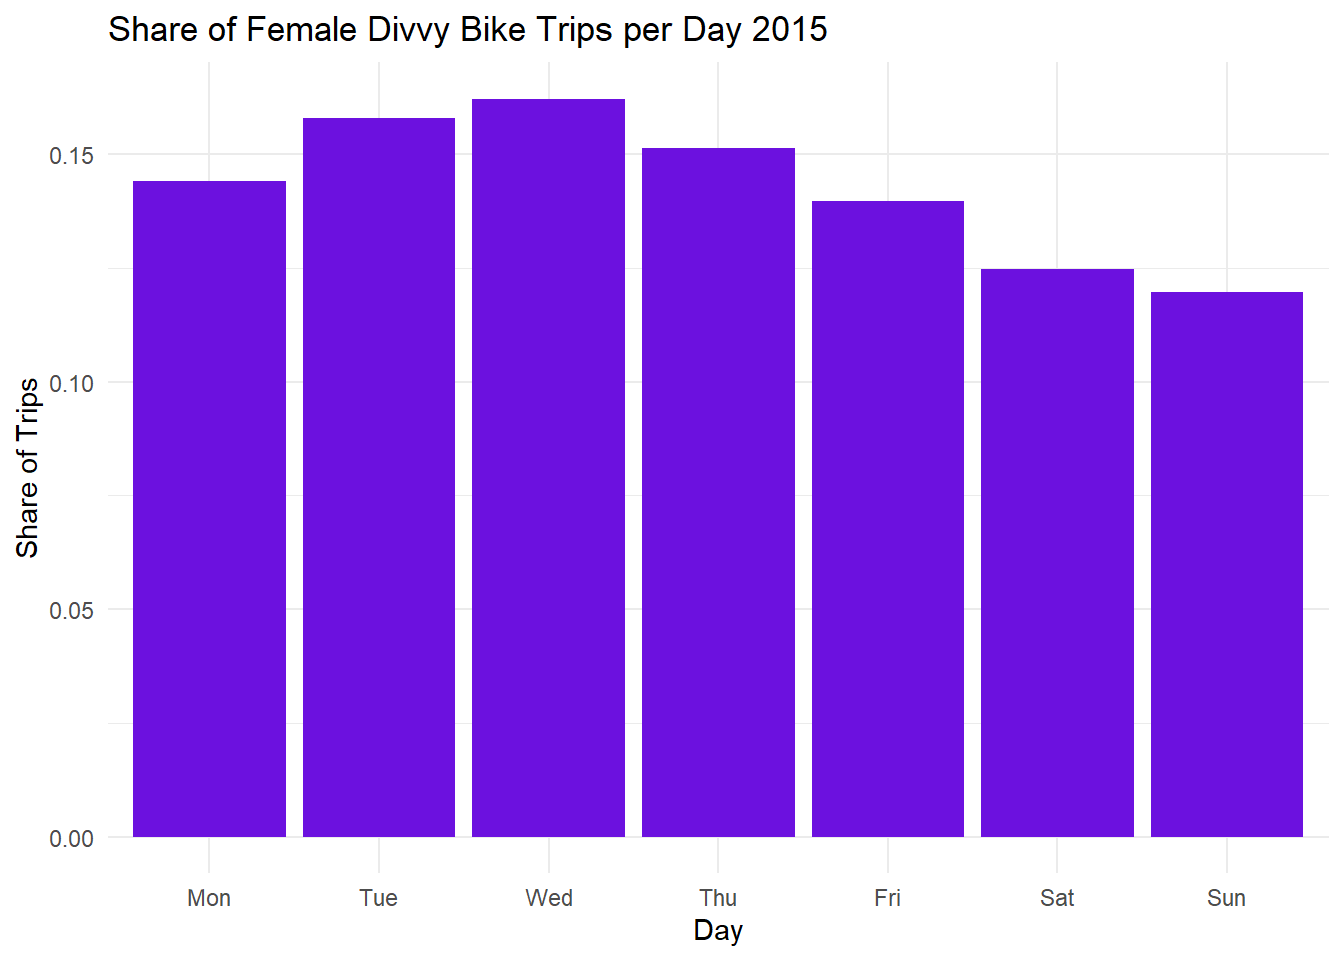
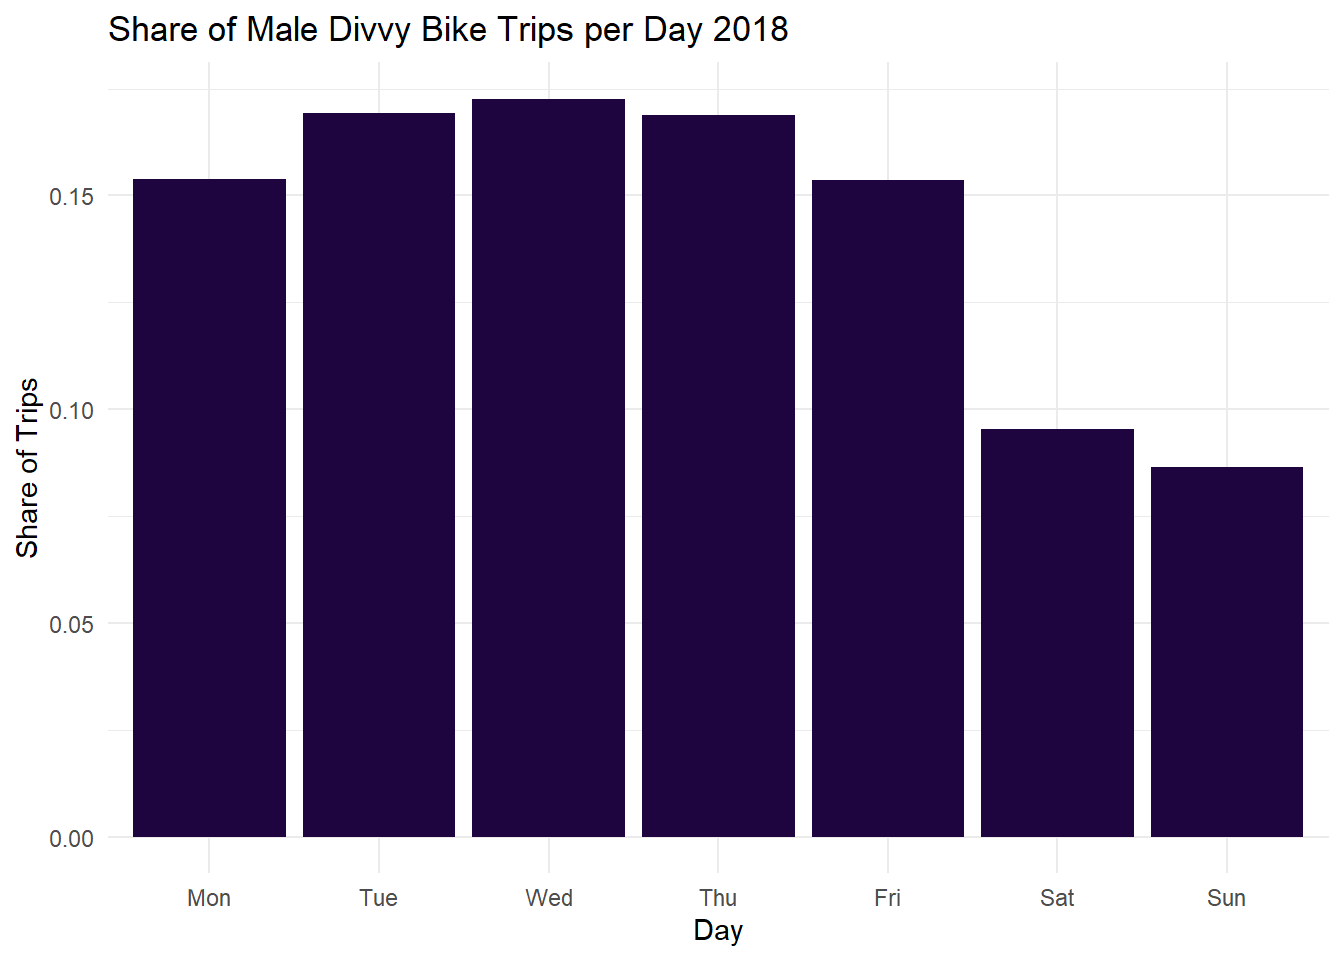
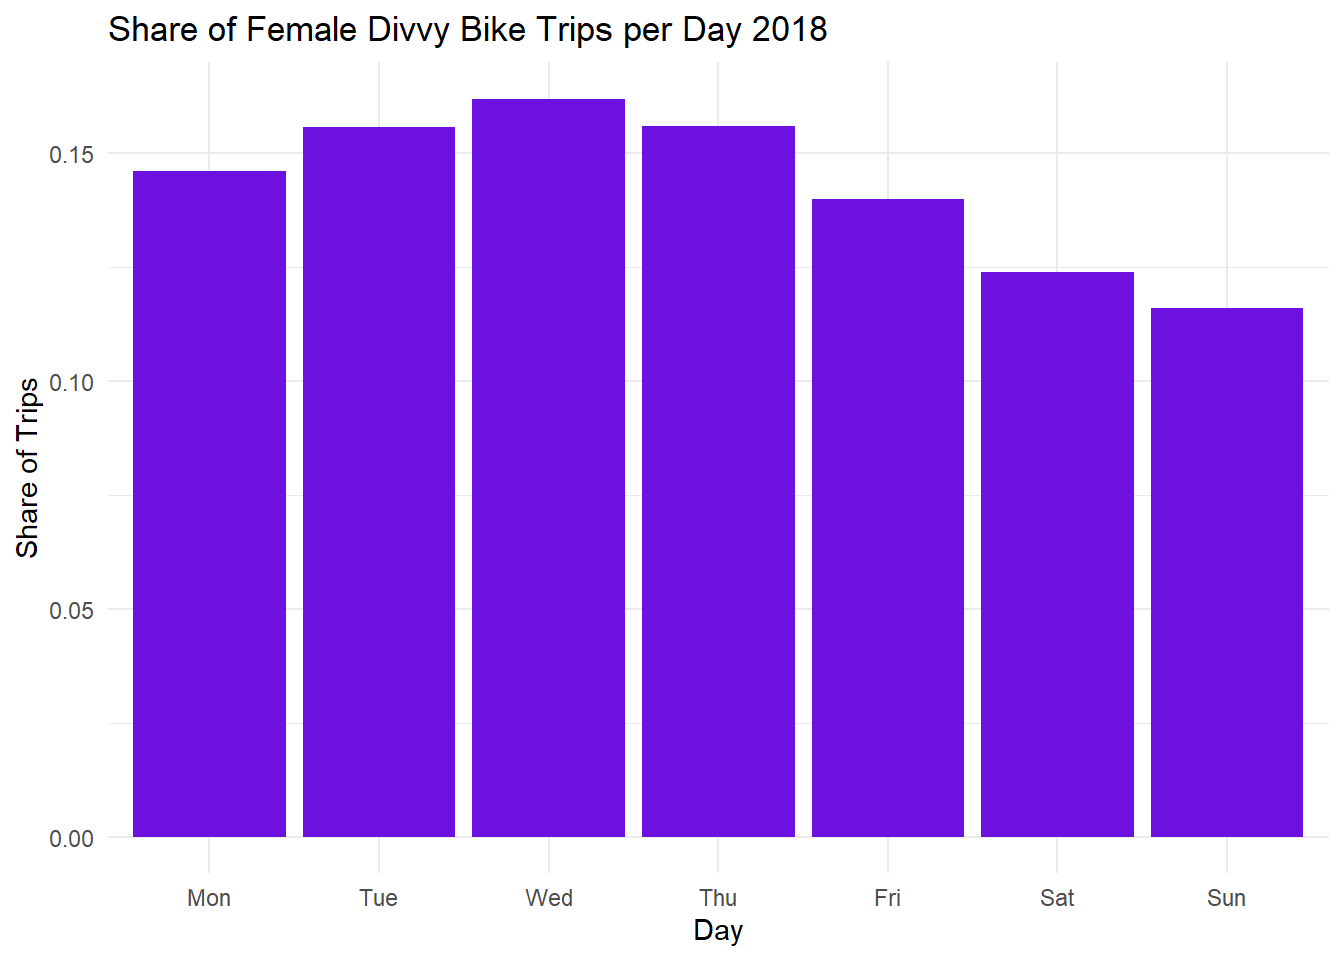
The analysis of the trip day of week shows that men generally make most of their trips on weekdays. Alternatively, women tend to disperse their rides over the week and weekend. These charts show that women may use Divvy bikes for more leisure trips or any non-work based trips when compared to men. This idea is upheld by the geographic dispersion of female trips as well.